

With the availability of alternative futures contracts based on related underlying instruments, it is often attractive to consider trading futures spreads, whereby similar futures are simultaneously bought and sold. One of the most common of these types of trades is the TED spread constructed by trading Treasury bill futures against Eurodollar futures.
In this case, both contracts relate to short-term (i.e., three-month) dollar-denominated interest rates. The TED spread trade thus reflects a view that these two underlying three-month rates will move differentially.
Over time, the concept of the TED spread has been extended, allowing for analogous transactions that bear on interest rate differentials pertaining to a range of maturities that extends beyond the three-month point on the underlying yield curves. This evolution has come to be known as “term TED spreads.” This article describes these various trades – their rationale, trade construction, and associated implementation issues.
TREASURY BILL AND EURODOLLAR FUTURES CONTRACTS
The Treasury bill futures contract is a price-fixing mechanism that locks in a rate on a three month U.S. Treasury bill with a deferred settlement date. Currently, expiration and delivery dates follow from the cycle of Treasury auctions. That is, each open Treasury bill futures contract is settled by physical delivery of $1 million par of U.S. Treasury bills. Deliverable bills must mature ninety-one days from the first of three allowable delivery days.
The Chicago Mercantile Exchange (CME) schedules quarterly expirations to maximize the supply of deliverable Treasury bills, so that the qualifying population includes old one-year bills and old six-month bills, each having three months of remaining life upon delivery, as well as new-issue ninety-one-day bills.
For example, the March 1997 Treasury bill futures contract expires (stops trading) on Wednesday, March 26, 1997. Bills that qualify for delivery must have ninety-one days of remaining life, counting from the next business day. So in this case, the required maturity date is June 26. Three different issues – an original one-year bill issued on June 27, 1996, an original six-month bill issued on December 26, 1996, and a new ninety-one-day bill issued on March 27, 1997 – satisfy the delivery requirements, as each has the requisite ninety-one days remaining until maturity.
The Eurodollar futures contract is similar to the Treasury bill futures contract. It too is traded on a quarterly cycle, although expiration days do not correspond to those of the Treasury bill contracts. For Eurodollars, expirations always fall two London business days prior to the third Wednesday of the month. This contract is said to be “cash-settled,” meaning that no physical delivery occurs. Instead, one last mark to market is made, where the final settlement price is assigned based on cash market yields, specifically reflecting the London Interbank Offered Rate (LIBOR) for three-month Eurodollar deposits, as quoted by the British Bankers Association.1 Each contract covers a national exposure of $1 million.2
Prices of both Eurodollar futures and Treasury bill futures are quoted on the basis of an International Monetary Market (IMM) index, where the associated rate reflected by the price index is found simply by subtracting that price from 100.3 For example, a price of 95.10 reflects an interest rate of 4.90% – a discount rate for the Treasury bill futures but an add-on money market yield for the Eurodollars.
THE BASIC TED SPREAD
Although three-month Treasury bill rates and three-month Eurodollar deposit interest rates generally move together – rising in times of monetary tightness and business cycle expansion and declining with monetary ease and cyclical weakness – the co-movement typically is not exactly equal. The TED spread, which reflects the difference between these two interest rates, may offer some attractive trading opportunities to those who can correctly anticipate such differential movement between the two rates.
Because Eurodollar deposits are direct obligations of private, offshore commercial banks, independent of the Federal Reserve System, investors believe them to be more risky and more likely to pay a higher interest rate than Treasury bills with a common maturity. As a consequence, the IMM price index for Eurodollar futures has been – and is likely to remain – lower than the price index for Treasury bill futures. At the root of any TED spread trade is the question of whether the present differential reflected in current futures prices is likely to change; and if so, will the differential increase or decrease?
One of the attractive aspects of the TED spread is its simplicity. An expectation that the spread will widen justifies buying the spread (i.e., buying Treasury bill futures and selling Eurodollar futures), while an expectation of a narrowing of the differential justifies selling the spread. The appropriate trade proportions are one-to-one.
1 Eurodollar deposits are dollar-denominated bank deposits held by commercial banks outside the continental U.S.
2 A revision of the Treasury bill contract currently under consideration will result in analogous cash settlement processes for Treasury bill futures.
3 The International Monetary Market is the division of the Chicago Mercantile Exchange that lists interest rates and currency futures and options.
4 This trade proportion will foster zero gains and losses as long as the futures price (rate)
Generally, trades are executed with a single order to buy or sell the TED, and prices are assigned to the respective “legs” of the spread. Note that, as long as the differential is appropriately reflected by the assigned prices, the individual prices are irrelevant, because any “error” would be offsetting on the two legs.
The cash market TED spread (i.e., based on spot market interest rates, rather than futures prices) has shown fairly extended periods of relative stability, interrupted by sharp movements and higher volatility. The 1979-1982 period was one high-volatility time span, when the spread ranged from a high of about 400 basis points to a low of about 100. This episode was associated with the effects of Paul Volcker’s monetary policy and the Mexican debt crisis.
A few years later, another bout of volatility appeared in May 1984, in connection with the Continental Illinois National Bank crisis. At that time, it appeared that a major money center bank was on the threshold of failing. The entire banking system seemed vulnerable, and investors became considerably less certain of the safety of Eurodollar deposits. As a consequence, a “flight to quality” ensued, whereby investors shifted their holdings out of Eurodollar deposits and into U.S. Treasury bills. Banks were forced to counter this shift by bidding up yields on Eurodollar deposits.
In response to the prospect of a major bank failure, the U.S. government (the FDIC, the Federal Reserve System, and the Comptroller of the Currency) took measures to keep Continental Bank afloat by protecting its depositors (uninsured, as well as insured). The crisis was defused, confidence in the system was restored, and the TED spread worked its way from its high of about 200 basis points to its pre-crisis level of about 100, in a span of a few months.
Since the mid-1980s, the TED has been much more quiescent. In the most recent two years, for example, interest rates have been remarkably stable. Even so, during this time the TED spread has oscillated over a 40-basis point range, allowing ample opportunity for trading activity.
Besides the flight to quality issue, the TED is also traded as a surrogate for a play on the level of interest rates. Exhibit 1 shows a direct relationship between the level of interest rates and the size of the TED. That is, during the interest rate cycle shown, the TED generally narrowed when rates declined and widened when rates rose. This relationship is by no means certain in any given short-run situation.
Differential remains constant, independent of the fact that the two respective interest
rates are quoted using different rate quotation conventions (i.e., discount rates for
Treasury bills versus add-on yields for Eurodollars).
TRADE IMPLEMENTATION ISSUES
When trading futures contracts, it is often appropriate to consider the “basis,” the difference between the futures price and the spot price of the associated underlying instrument. Specifically, if the expected change in the spot price over the horizon to the futures expiration date is already embedded in the futures price, the rationale for initiating a position could be mitigated.
To clarify, first consider the issue in the context of an outright futures trade, rather than a spread trade. Suppose, for example, that the discount rate on the three-month (spot) Treasury bill is 5.00%, and you expect this rate to rise by, say, 25 basis points, to 5.25% by the next futures expiration. You would likely be tempted to sell the nearby Treasury bill futures contract.5
5 Recall that futures prices reflect 100 minus futures interest rates. An expectation that the interest rate will rise is equivalent to an expectation that the futures price will fall.
If the futures price were currently trading at 94.75 (already reflecting a rate of 5.25%), however, the trade would not be appropriate. That is, if expectations were realized, the futures price would remain at its current price of 94.75, so that no profit would result from the trade. In fact, if the current futures price were below 94.75, and you thought the increase in the spot rate would be limited to no more than 25 basis points (i.e., the futures price would go no lower than 94.75), a long futures position would be justified.
The same basis consideration applies when trading spreads. Prior to the expiration of one of the underlying futures contracts (i.e., the first of the two relevant expirations), the TED spread constructed with spot interest rates will likely differ from the spread constructed with futures prices, but spot and futures spreads will generally converge as the expirations approach. As long as the Treasury bill futures require physical delivery, convergence to the spot price will not necessarily be complete, as the Eurodollar and Treasury bill futures expirations do not occur simultaneously. An intended change to a cash-settled Treasury bill contract, however, will synchronize the expirations and foster complete convergence.
To demonstrate, consider the conditions shown in Exhibit 1, reflecting prices (rates) some months prior to the expiration of the Eurodollar futures contract.
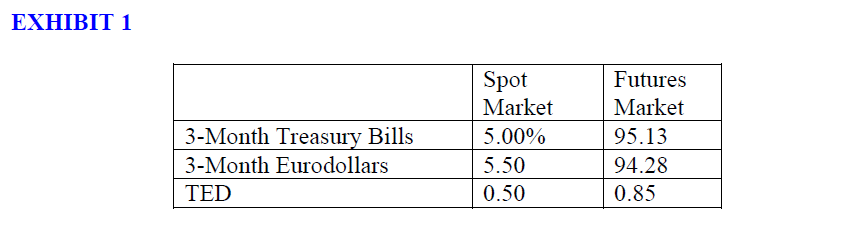
In this case, the futures TED is trading at a 35-basis point premium to the spot TED. As a consequence, if spot rates remain unchanged over the next two months, the futures spread would have to adjust downward, generating a gain for the short TED spread position. Put another way, for a long futures TED spread to be profitable, the spot spread would have to rise by more than 35 basis points by the time the first component futures contract expires. Thus, the spread basis fosters an edge to one side of the trade and somewhat of a penalty to the other. In this case, the edge accrues for the short TED position, while the penalty applies to the long.
The basis consideration is particularly important in the context of using a TED spread as a surrogate for an outright interest rate position — particularly when yield curves are steeply sloped. When yield curves are steeply upward-sloping, outright futures prices generally trade at a large discount to spot prices; when yield curves are downward-sloping, futures trade at a large premium.
As noted earlier, to the extent that basis conditions reflect expectations of a prospective market move, the rationale for trading is mitigated. If the basis conditions were roughly equivalent for both Treasury bill and Eurodollar futures, however, the TED basis would be close to zero (i.e., the two basis effects are offsetting). As a consequence, no basis edge or penalty would apply to the TED. Thus, when basis conditions appear to be unattractive for outright futures, the TED spread may not suffer the same unattractive characteristics.
THE TERM TED SPREAD
Beginning in the early to middle 1990s, the market took trading basic TED spreads a step further. Participants started trading longer-term Treasury notes against strips of Eurodollar futures.6 For example, buying (selling) a two-year term TED would involve buying (selling) a two-year cash Treasury note in the spot market and selling (buying) a two-year Eurodollar futures strip (i.e., a strip composed of eight contracts).
6 Strips are a construction that employs a sequence of successive Eurodollar expirations (e.g., March, June, September, etc.).
The decision to enter a term TED spread (rather than the traditional TED) is justified by the same kind of interest rate expectations that motivate the traditional TED spread, albeit for a different point on the yield curve. The earlier example, for instance, focuses on the two-year points on the Treasury and Eurodollar yield curves. Just as before, a judgment that the spread will widen would justify buying the Treasury instrument and selling the strip, and vice versa for the reverse expectation.
The starting point for assessing whether a term TED is an attractive trade requires evaluating the strip yield from a set of component Eurodollar futures prices and then comparing this calculated yield to the yield on a government obligation of similar maturity. A rigorous calculation of strip yield, which reflects the compounding of interest, requires a two-step process.
First, explicitly using the days between successive Eurodollar futures value dates in the calculation, we find the terminal value of a dollar by assuming a quarterly reinvestment/refunding rate based on successive futures rates, as per Equation (1):

Given this value of Tn, the yield to maturity of the n-quarter strip is found by solving Equation (2) for R*:
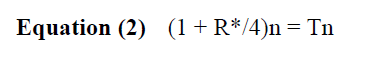
R* therefore pertains to the yield to maturity of a zero-coupon instrument with quarterly compounding.
Strictly speaking, this rate calculation is not comparable to rates quoted on Treasury notes and bonds for two reasons:
1. While the strip yield pertains to a zero-coupon instrument, the Treasury is a coupon-bearing security with semiannual compounding.
2. The strip corresponds to a forward time interval beginning with the first futures value date and extending three months beyond the last futures value date, while the Treasury pertains to an imminent time span from today’s spot value date to the maturity date.7
7 Some analysts deal with the latter concern by adjusting the strip yield calculation to include a “stub” – a multiplicative term [1 + Rs(ds/360)] to reflect the period preceding the strip, where Rs is the stub rate and ds is the number of days from the spot value date to the first futures value date. Additionally, the weight given to the last futures contract in the yield calculation would typically be adjusted to make the coverage of the combined stub plus strip correspond to the remaining life of the bond or note.
PREDOMINANT TRADE CONSTRUCTION METHODOLOGY
Although no unique method for arranging a term TED is universally accepted, a number of analytical subscription services offer algorithms that are widely used. While the precise Eurodollar futures positioning may differ somewhat from model to model, most of these services recommend a disproportionate weighting of successive futures contracts, with declining numbers of futures for more distant expirations. This outcome follows if one conceptualizes the Treasury security as a series of zero-coupon components.
For example, a two-year semiannual coupon-bearing security is identical to the following pieces: three zero-coupon instruments of six-, twelve-, and eighteen-month maturities, each with a terminal price equal to the coupon amount, plus a fourth zero-coupon instrument with a twenty-four-month maturity and a redemption value equal to the sum of the original par amount plus the final coupon payment. The price of this bond, then, is the sum of the respective present values of the four pieces, where the four different discount rates necessarily reflect the four different maturities (i.e., six months, twelve months, eighteen months, and twenty-four months, respectively).8
To hedge this bond properly, it would be necessary to hedge each component with an equally weighted Eurodollar futures strip – the first two Eurodollar contracts to hedge the first component, the first four contracts for the second, the first six contracts for the third, and the first eight contracts for the last.9 The complete hedge would then be a consolidation of the four component hedges.
Note that this complete hedge will end up with a disproportionate weighting along the strip, giving greater weight (i.e., more contracts) to the first pair of contracts, as these appear in all the component hedges, and declining weights to successive pairs. Unfortunately, this weighting may be undesirable for the TED spread trader who simply wants to bet on the raw difference between strip yields and Treasury yields.
Consider a situation where offsetting price changes occur in two specific Eurodollar futures contracts, leaving the strip yield unchanged. Under this assumption, the speculator who focuses on the raw rate differential would hope to realize a zero effect on the futures portion of the trade – neither a gain nor a loss – irrespective of what happens with the Treasury security. If declining weights are assigned to successive Eurodollar contracts, however, this outcome will not follow.
8 Given that this is a government security, discount rates should reflect risk-free, zero-coupon rates.
9 Although the notional value of zero-coupon instruments increases with the accrual of interest, a proper hedge applies a present value factor that offsets this effect. Under the assumption that the underlying three-month periods are of uniform lengths, hedges should thus be constructed with equal weighting across all contracts. See Kawaller [1995] for a broader discussion of the point that an equally weighted strip serves as the appropriate hedge construction for zero-coupon securities.
ALTERNATIVE METHODOLOGY
An alternative approach is demonstrated by an example. Assume a focus on the two-year Treasury versus an eight-quarter Eurodollar strip. Using the prices shown in Exhibit 2 and using Equations (1) and (2), the strip yield is calculated to be 6.20%. We then perturb each futures contract individually, varying its price (rate) by 1 basis point, to measure that specific future’s influence on the strip yield.
For example, changing the first-quarter rate from 5.62% to 5.63%, while keeping all other futures rates the same results in a 0.1265-basis point change in the strip yield. This process is repeated for each component of the strip, with the results shown in the last column of Exhibit 2.
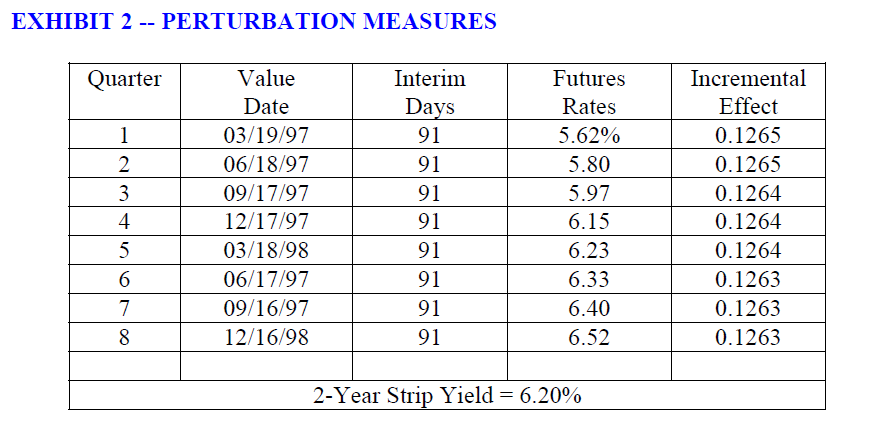
As long as the time intervals (i.e., interim days) for each of the relevant futures contracts are uniform, as they are here, the incremental effects of the various futures contracts will be fairly comparable. But they will not be precisely equal unless the successive futures rates are constant across the strip.
At least in theory, as long as the component time intervals are uniform, the impact of a change in the contract with the lowest interest rate will have the largest influence on the strip yield, while the contract with the highest rate will have the smallest impact. These distinctions, however, can easily be lost in the rounding. In the current case, with forward rates rising as the horizon extends, the incremental influences edge lower and lower for successive contracts.
The appropriate position size for each expiration is found by assuming that the Treasury security’s yield changes by the identical incremental yield change that follows from each perturbation, which in turn results in a given price effect on the security. A sufficient number of contracts are then used to generate that same dollar value.
Again, by example, the perturbation of the first contract results in a strip yield change of 0.1265 basis points. The price effect on the Treasury security is found by substitution into Equation (3):
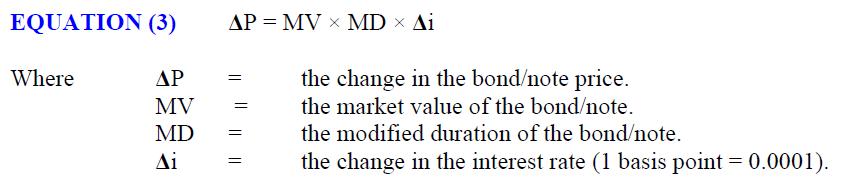
For illustrative purposes, assume the bond in question is a two-year instrument with present value of $8.8885 million and a modified duration of 1.942. Recognizing that each basis point change in the futures rate fosters a $25 mark-to-market effect, the proper position size for each futures expiration is found by dividing the associated ΔP by $25. For example, for the first futures contract, the proper position is 8.8885 million x 1.942 × 0.00001265/25 = 8.73 contracts.
Repeating this process for all eight contracts yields hedge ratios that show a barely perceptible decline over the expiration horizon, as one moves to later and later expirations, only discernible if calculations are carried to the second decimal place. These results are displayed in the second column of Exhibit 3.
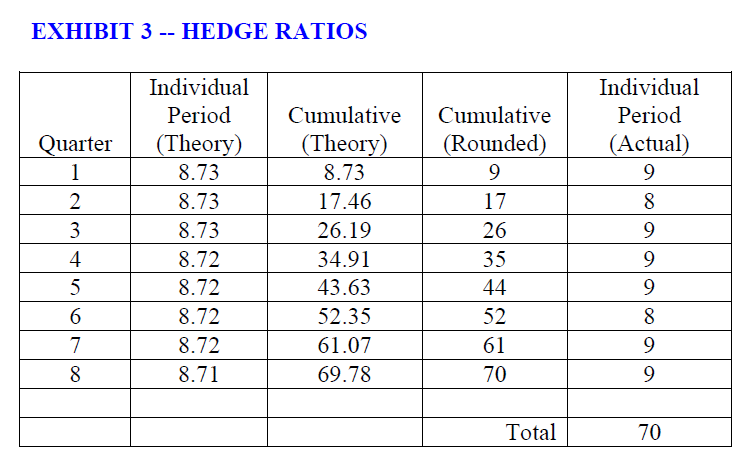
In most cases, implementation of the strip position is complicated by rounding considerations, as only whole numbers of contracts can be traded. In this case, rounding all the positions up to nine contracts each would result in a total futures exposure of seventy-two contracts – two greater than what is needed. Selecting the specific contract months to have eight contracts (rather than nine), however, is a subjective decision.
Ultimately, one’s view of the prospective movement of the yield curve should drive this choice. That is, if buying Eurodollar futures contracts, fewer contracts should go to the expirations expected to post the smallest relative price increase. If selling, fewer contracts should go where the smallest relative price decline is expected.10 A more neutral approach, however, would arrange the strip to keep the cumulative number of contracts equal to its rounded requirement. This weighting is shown in the last column of Exhibit 3.
In executing this trade, take into consideration that “packs” and “bundles” can be traded with a single order. Packs are equally weighted four-contract strips, or one year of futures contracts, corresponding to contracts in Eurodollar futures years 2 through 10. The CME color codes for prospective years are: 2-red; 3-green; 4-blue; 5-gold; 6-purple; 7-orange; 8-pink; 9-silver, and 10-copper.
Orders are placed for the desired number of futures required in each expiration (rather than the total number of contracts), at a price change from the average of the previous day’s settlement prices on the relevant underlying futures. The minimum price increment for packs is a half-tick or 0.005.
For example, one could buy a pack of four reds at 1.5 ticks up (i.e., four contracts in each of expirations five through eight), where the average price is 1.5 ticks higher than the average of the prior settlement prices of the respective contracts. As with TED spreads, prices of individual contracts are assigned later.
Bundles are longer Eurodollar strips covering one, two, three, five, seven, or ten years of contracts, generally beginning with the nearby contract.11 Like packs, prices for bundles are quoted as a change from the prior day’s average settlement price, but quotations can be made in quarter-tick increments. A formal algorithm is used to assign prices to component expirations.12
10 This evaluation is ultimately driven by one’s view of prospective yield curve adjustments. See Kawaller [1991].
11 As the nearby contract approaches expiration, bundles starting with the “second-to-expire” will be introduced.
12 For a more complete discussion of this algorithm, as well as a general discussion of packs and bundles, see Sturm and Barker [1996].
Given the requirements shown in Exhibit 3, it is likely that the futures portion of the term TED would be executed as an eight-contract, two-year bundle (i.e., eight contracts in each of the first eight Eurodollar futures), plus six additional single contracts in all but the second and sixth expirations.
For those cases where the desired weighting is virtually uniform across the span of the strip (as above), one might be tempted to use a shortcut method for determining hedge ratios. For instance, assuming a one-for-one relationship between Eurodollar rates and Treasury yields, the total futures requirement is found by dividing the desired dollar value of a basis point for the bond by $25. The dollar value of a basis point is found using Equation (3), plugging in 0.0001 for Δi.
In this example, the total is 1,725/25 = 69 contracts – one less than the total dictated by the perturbation method. This difference arises because the starting assumption is not quite correct: A single basis point change in all the forward rates fosters a slightly larger-than-1-basis point effect on the strip yield. Clearly, when trading with small notional values, this level of precision is lost in the rounding, but for professional traders dealing with larger amounts, the more precise perturbation method for determining hedge ratios is preferred. Even for larger positions, however, this quick-and-dirty calculation has the benefit of providing a ballpark estimate for the appropriate size of the futures position.
FURTHER CAVEATS
Just as the basis warrants consideration in the decision to employ the originally discussed one-for-one futures TED spread, an analogous issue applies in the case of term TEDs. With the purchase or sale of a cash Treasury security, there is an associated “carry,” reflecting the difference between the financing (or opportunity) cost and the associated interest accrual. Depending on which is greater and whether the security is bought or sold, this carry consideration may be either beneficial or adverse.
Turning to the Eurodollar strip side, a basis convergence adjustment applies, just as it does for an individual futures contract. Measuring this consideration for a strip, however, is more difficult than for a single contract, as the strip’s theoretical underlying zero-coupon Eurodollar deposit with a maturity in excess of one year is not traded actively in the marketplace. Thus, the magnitude (and even the direction) of this convergence effect is likely to be uncertain.
As an estimate of this effect, one could try to identify a dollar-denominated Eurobond or note with a credit standing equal to that of the banks reflected in the British Bankers’ Association LIBOR survey, with the caveat that these coupon-bearing rates need to be converted to their zero-coupon equivalents.13 Because of the lack of transparency of this hypothetical underlying yield, however, this component of the carry/basis consideration should be viewed with uncertainty. Note that the carry/basis issue becomes moot if one “day-trades” this spread, making sure that all positions are offset before the close of business each day.
13 The bootstrapping method allows for the conversion of coupon-bearing rates to their zero-coupon equivalents. See Caks [1977].
Besides the carry/basis issue, another feature of the term TED deserves mention, relating to the convexity of bonds and notes. The hedge ratio determination method is designed to generate gains when an interest rate differential moves in the direction anticipated. At the same time, if the differential remains constant – even if component interest rates vary – the properly designed term TED should generate near-zero results.
Unfortunately, because bonds and notes are convex (i.e., falling interest rates generate larger price effects than rising interest rates), the proper matching on term TEDs occurs only for “small” interest rate changes.
For example, consider the effects on the above term TED trade of changing all futures rates by 50 basis points. In theory, the resulting strip yield change would be 50.56 basis points. For the term TED spread to remain constant, the yield to maturity on the two-year note would have to adjust by the same 50.56 basis points.
Irrespective of whether interest rates rise or fall, the futures will generate an $87,500 effect (= 50 basis ×points × 70 contracts × $25 per contract). The Treasury side will generate slightly more with rising interest rates, slightly less with falling rates.
It should be clear, then, that this convexity effect will consistently benefit the long-term TED position. That is, keeping the yield differential constant, rising interest rates will result in larger gains on the Eurodollar futures than losses on the Treasury bond, and falling interest rates will result in larger gains on the bonds than losses on the futures. The convexity of the Treasury securities thus imparts a bias of the trade.
While this effect needs to be recognized, it should not be overstated, because the magnitudes of these effects may not be considered significant. Moreover, these imbalances would be mitigated if hedge ratios were periodically adjusted, reflecting the changing bond/note modified durations that result from changes in interest rate levels or the passage of time.
CONCLUSION
The TED spread trade allows for the taking of positions designed to profit from correctly anticipating changes in credit risks associated with U.S. Treasury securities, on one hand, and Eurodollar deposits on the other. If properly constructed, these trades generate rewards if expectations are realized, irrespective of whether interest rates generally rise or fall.
Given the capability of trading Eurodollar futures contracts on a quarterly cycle that extends to forty quarters, these trades can target specific points on the yield curve, ranging from three months to ten years. At the three-month horizon, proper trade construction is trivial, requiring a one-for-one offset of Eurodollar and Treasury bill futures. With longer horizons, TED trades are generally taken to mean offsetting positions in cash Treasury securities and strips of Eurodollar futures.
Implementation of such term TEDs is somewhat more complicated, because the appropriate trade proportions are not fixed as they are with three-month TED spreads. Nonetheless, having the capacity to design these trades makes it possible to seek out trading opportunities from a host of possible interest rate pairs.
REFERENCES
Caks, John. “The Coupon Effect in Yield to Maturity.” Journal of Finance, Vol. 32, No. 1 (March 1977).
Kawaller, Ira G. “Eurodollar Bundles and Hedging Considerations.” Journal of Financial Engineering, Vol 4, No. 1 (March 1995).
__ “Stacking vs. Stripping with Eurodollar Futures.” CME Strategy Paper, 1991.
Sturm, Frederick, and Peter Barker. “What’s New in CME Interest Rates – Bundles, Packs & Stubs.” CME Strategy Paper, 1996.